
(Reading time: 7 minutes)
There was something forlorn about the forum earlier this past week, sponsored by Building Bridges for the Greater Good, which was intended to spotlight teenage homelessness. The microphones offered frequent bursts of loud, jarring static. The stage of the Kate Collin Middle School in Waynesboro, where a similar forum was held a year ago, was more sparsely inhabited this time around—and looked it. The youngest person to take a mic was no longer a teenager, although finding someone of school age to bare his or her soul to several dozen onlookers might have been too much to expect.
Still, without the first-hand testimony of young lives wounded by the uncertainties and instability of homelessness, all that was left were the same old arid statistics that shock but often fail to move: 52 unhoused students in Waynesboro as of Oct. 13, 28 of them living in hotels and motels. Another 26 Waynesboro students living in foster homes, which Ryan Barber, the district’s assistant superintendent, described as “homeless adjacent.” Nearly 200 families across three schools turning to local food pantries each Friday.
No one from Staunton spoke on behalf of that city’s homeless youths. A social worker from Augusta county schools had little to add, seemingly content to let Barber do most of the heavy lifting.
If there was any strong audience reaction to what was said at the forum, it came—twice, with hearty rounds of applause—in response to statements that the long-term solution to such problems is more affordable housing. It’s hard to argue otherwise, since it’s obvious that without affordable housing more people will end up in the streets, but it’s also a term that goes largely undefined and unexplored. The upshot locally has been at least two years of hand-wringing and unfocused discussion that rarely gets at the heart of the issue, which at its core is nothing more than the mismatch between household incomes and housing costs.
“Affordable” housing, including rent or mortgage plus utilities, is typically defined as housing that doesn’t exceed 30% of one’s income. More than that and other basic needs get strained or unmet, including food, clothing, medical expenses, transportation, child care and so on. The sad part is that we haven’t seen anything close to that 30% ratio since March, 2022, when affordability fell of a cliff (see chart below) to levels not seen since the Great Recession of 2008.
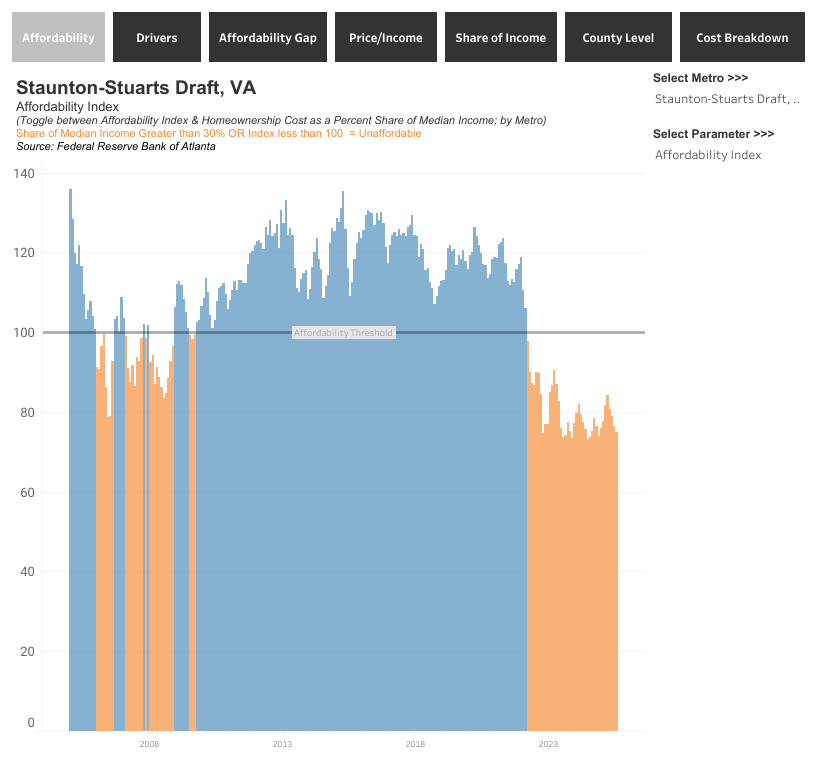
This and other illuminating graphs, compiled by the Federal Reserve Bank of Atlanta, illustrate in several ways how badly we as a society are dealing with our housing issues. For openers, observe that housing today is even more unaffordable than it was in the period leading up to and following a global financial crisis that was triggered by a collapsing U.S. housing market. Although the two crises have differing causes, it’s worth noting that the 2008 collapse resulted in massive government intervention and an all-out effort to stave off another Great Depression. There is nothing comparable today, which means that our housing recession has not only been completely uninterrupted—none of those blue spikes to interrupt a sea of orange—but with no hope that anything’s about to change.
Here’s another way of visualizing the same dynamic, charting the median household income needed to buy a median priced house:

Again, the current lack of affordability exceeds that of the Great Recession. Moreover, the reality is worse than depicted above, since the Atlanta Fed’s statistics include all the components of mortgaged home ownership but do not include utilities. But what is measured is bad enough. The most recent (August, 2025) share of median income going to housing is 39%, the same level reached in July of 2006. By comparison, the lowest share of median income going to housing was in April, 2015, when it dipped to 23%.
With only two statistics going into computing affordability, it’s worth drilling down a bit to see how much each has contributed to our unbalanced ratio. The median household income for our area was $42,819 in mid-2006, $46,661 in April of 2015 and $67,199 a couple of months ago. The median homeownership cost for those same months was $194,033, $164,533 and $308,900. In other words, the cost of homeownership in 2015 was 3.5 times household income, compared to 4.6 times today.
Looked at another way, household income rose 9% over the first near-decade of this comparison, even as homeownership costs dropped 15%. In the decade since? Household income went up 44%, but homeownership costs exploded at twice that rate, by 87.7%. No wonder home ownership has become unaffordable—or that rental rates are likewise skyrocketing, thanks to frustrated homebuyers turning to other shelter options. And just like a rolled-up toothpaste tube, those who can’t keep up get spit out at the other end, ending up couch-surfing or in short-term motel rooms or in their cars or a tent.
Since we’re not about to see a doubling of household income—indeed, given current economic and federal policy trends, we’ll be lucky to see any increase—the only alternative for lowering the affordability threshold is to decrease the cost of homeownership. One way for that to happen is through lower mortgage interest rates, but that’s beyond our meager capabilities, and interest rates are in any case only a secondary factor in housing costs. Even more on the margin are property taxes and home insurance, both of which have climbed over the years but still remain relatively minor components of a monthly mortgage payment. That leaves just one thing we might influence to promote affordable housing: the cost of home building itself. That’s where the conversation should be focused, and it’s also where the conversation has been most lacking.
Home construction is a numbers game that is most profitable when it enjoys economies of scale. As with interest rates, many of the costs that go into that equation—labor, materials, weather—are beyond our control except at the margins. But the one variable over which municipalities have a say is land use. The more housing units that can be built on a particular lot, the lower the per-unit cost of the finished homes. Build a $500,000 house on a half-acre because a lower-cost house won’t pencil out, or build a four-plex with each unit priced at $200,000 and make the same return on investment—and create four times as much housing, each at an affordable price.
That latter option, however, requires a wholesale reexamination of zoning codes and maps, and that’s something Staunton has avoided. The city’s 11-point housing “strategy,” conceived by a working group of housing advocates that not once discussed the role of zoning in driving up housing costs, nibbles around the edges of land-use policies by exploring the possibility of allowing accessory dwelling units. The bulk of the proposed housing strategies, however, merely advocate lots of talking and not so much action: legal services for renters, for instance, or landlord “education.” The nitty-gritty task of grappling with outdated notions of urban planning, meanwhile, apparently proved a step too far.
And so we have moments like Monday’s forum, offered under the hopeful tag line, “I am homeless and still I dream.” Those of us who aren’t homeless are also dreaming—dreaming if we think we’re actually moving the needle on affordable housing, as even a quick look at the charts above should drive home. What’s that phrase, often mis-attributed to Einstein, about the definition of insanity. . . .?
